Using a HAR Viewer to Visualize Your Assets

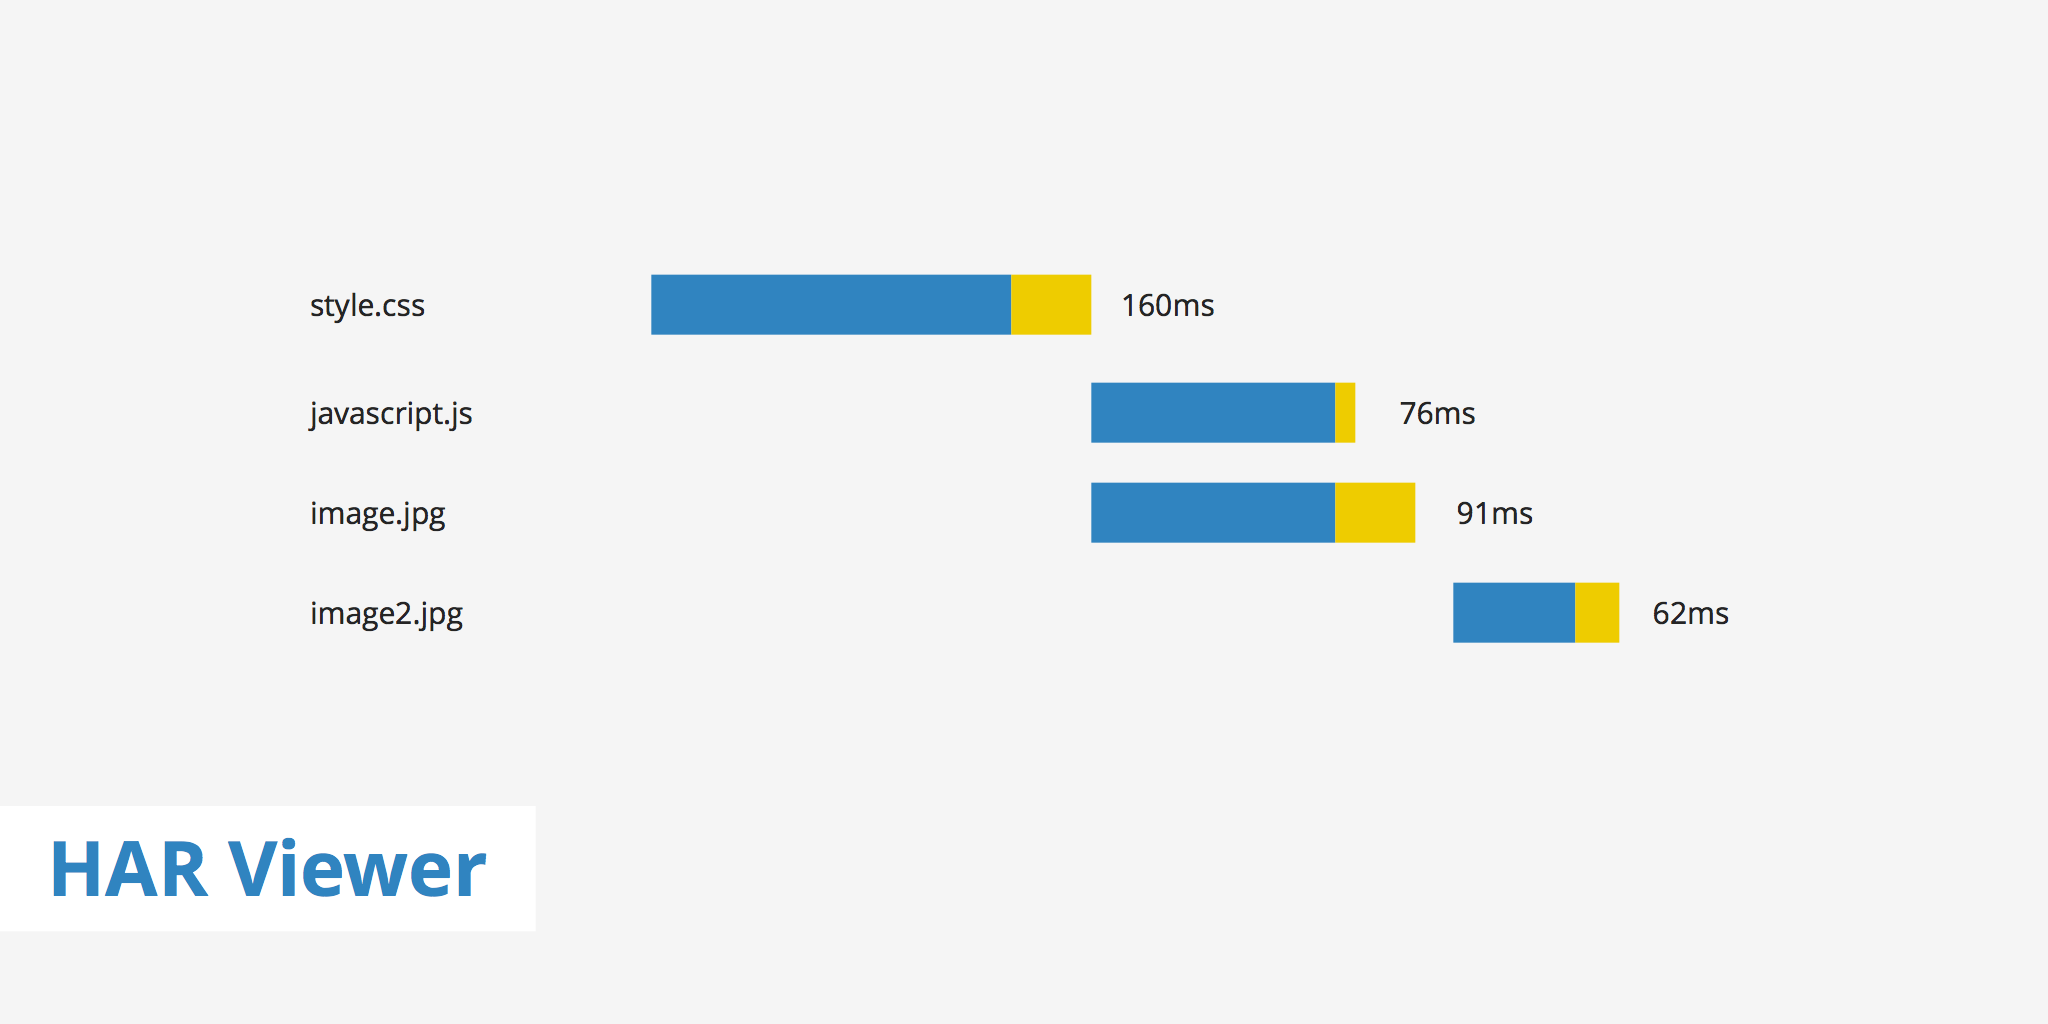
A HAR viewer or HTTP Archive viewer is an online tool used to visualize the loading process of a particular website's assets. This is known to many as the waterfall view in a browser's development tools. A HAR viewer can also be found in online speed test tools or through software specifically designed to import HAR files.
In this guide, we're going to discuss how to use a HAR viewer to import HAR files as well as identify what other HAR viewer options are available.
How to Use a HAR Viewer?
Browsers and online test tools are great for showing the loading patterns of a particular site. With these tools, you can easily identify which resources are taking a long time to load, which ones are blocking the DOM, etc. However, in the event that you're working on a site that hasn't been published yet and need to share the waterfall view with someone else, online speed tests and browser network tabs won't work.
In this case, you'll need to export a HAR file and then preview it with a HAR viewer such as the HTTP Archive Viewer. There are a few different ways to create a HAR file depending upon which browser you're using. For this example, we're going to use Google Chrome.
- The first step in this process is to go to the website you want to generate a HAR file for, open the Chrome DevTools, navigate to the Network tab, and reload the page. This will display the entire list of resources that site uses.
- From here, you can right-click anywhere within the DevTools window and select the "Save as HAR with Content" option.
- Once the HAR file is saved, you can then either copy/paste the contents into the HTTP Archive Viewer's data field or drag and drop the file anywhere on the page. This will display the preview page showing the complete waterfall, timing results, statistics, etc.
HAR Viewer Options
The HAR Viewer tool shows various details about a website's loading structure. These can be further analyzed to help determine where any performance bottlenecks are originating from. For instance, the statistics section displays information about the load time of all assets, the type of assets being loaded, the size of the headers/bodies sent and received, as well the size and number of downloaded files.
Hovering over a particular asset also shows additional data such as:
- Blocking time
- Sending time
- Waiting time
- Receiving time
If a particular file is taking a long time to load, you may want to further investigate why. This may result in the need to cache said file with a CDN, modify at which point in the DOM it is loading, or removing the asset completely if it is not vital.
Other HAR Viewing Tools
Apart from using the online HAR viewer mentioned in the article, there are also a few other options available which will display the same data. These include:
- As previously mentioned, you can access this information from your browser's development console as long as you can access the site directly
- Online speed test tools provide a waterfall view and loading information regarding a site's web assets
- Chrom extensions such as HTTP Archive Viewer provide you with an "app-based" view of the same functionality as the tool described in this article.
Summary
In the event that you want someone else to take a look at your HAR file due to the fact that is was generated under special circumstances or the site is simply not live to the public yet, using a HAR viewer can help. HAR files contain lots of information allowing you to much more conveniently determine the source of a particular issue and resolve it accordingly.